
Before you start running participants it is important to set up your data collection sheets. There are a lot of different ways to do a statistical analysis, but in our lab we have SPSS which does a lot of work for you (see Figure 1).
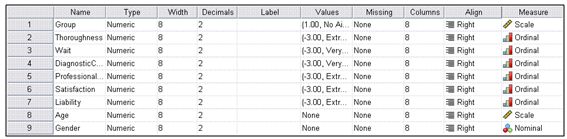
Figure 1. SPSS allows you to set up your spreadsheet by naming variables and also determining the level of measurement. Taken from SPSS
It is set up similar to an excel spreadsheet in that the DV’s you are examining are across the top (see Figure 2).
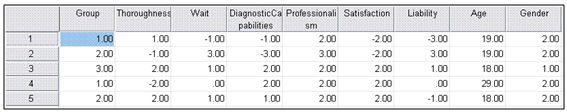
Figure 2. Once your spreadsheet is set up in SPSS you can view it and model your excel spreadsheet after it. Taken from SPSS.
It is good practice to set up both your SPSS spreadsheet and your excel spreadsheet to be the same (see Figure 5). This will allow you to copy and paste your data into SPSS for quick statistical analysis.
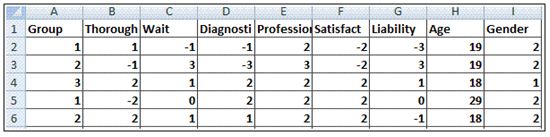
Figure 5. Model your excel spreadsheet after the one in SPSS. You can simply copy and paste your data into SPSS and quickly perform your analysis
Using SPSS for Statistical Analysis Section-Manual
Resources:
The following are some additional reading resources that you may find useful:
SPSS and Statistics Resource: Cronk, B. (2011). How to use SPSS (7th ed.). Pyrczak.
Statistics Resource: Aron, A., Aron, E., & Coups, E. (2005). Statistics for Psychology (4th ed.). Pearson.