
When performing research it is essential that you are able to make sense of your data. This allows you to inform other researchers in your field and others what you have found. It also can be used to help build evidence for a theory. Therefore an understanding of what test to use and when is necessary. There are some good practices to do if you are not familiar with performing statistical analysis. The first is to determine your variables.
Overview of basic statistics:
Dependent variable (DV)-This is the one that you are measuring. From the example of the student’s score.
Independent variable (IV)-This is the one that you are manipulating with the different conditions. From the example either PowerPoint or overhead projector presentation.
Levels of Measurement:
Once this has been done you will want to determine the level of measurement that both variables are. This will help you later determine what test to use in your analysis. There are four levels of measurement:
Interval-These have equal numbers (i.e. Number of pets).
Ratio-There is no real zero and there are intervals between whole numbers (i.e. Birth weight)
Nominal-Simply naming categories (i.e. Male/Female).
Ordinal-Simply ordering (i.e.1=Strongly disagree; 2=Disagree; 3=Neutral; 4=Agree; 5=Strongly agree).
Finally, you will have the information needed to determine what test you need to use. Until you get familiar with doing statistical analysis, it is good practice to keep track of this information (see Table 3).
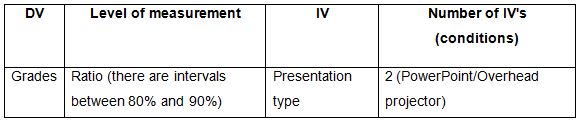
Table 3. Variable, level of measurement and number of IV’s
With this information you can refer to the following chart to determine what statistical test to use. First determine whether the study is within or between subjects, then the number of groups, then the level of measurement (see Figure 1).
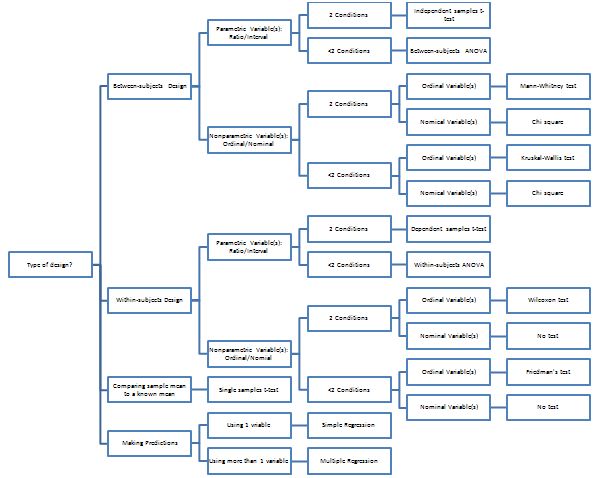
Figure 1. Chart of tests by design, number of conditions, and level of measurement
Statistical Tests can be broken into two groups, parametric and nonparametric and are determined by the level of measurement. Parametric tests are used to analyze interval and ratio data and nonparametric tests analyze ordinal and nominal data. There are different tests to use in each group. We will start with the parametric tests first.
Parametric Tests: (Interval/Ratio data)
These tests assume that the data is normally distributed (bell curve) and are very strong when compared to nonparametric tests.
Within Subject Design 1. Dependent samples t-test: Compares means of two groups. An example is determining if PowerPoint or an overhead projection impact grades. 2. Within subjects ANOVA: Compares means of more than two groups. An example is determining if PowerPoint, overhead projection, and podcast impacted grades and if so which one.
Between Subject Design
- 1. Independent samples t-test: Compares means of two groups. An example is determining if a PowerPoint presentation impacted grades compared to a control group.
- 2. Between subjects ANOVA: Compares means of more than two groups. An example is determining if PowerPoint or an overhead projector impacted grades and if so which one.
- 3. Pearson Correlation: Determines if there is a relationship between two variables. It also determines the strength of the relationship, if one exists.
The correlation coefficient ranges from -1.0 to 1.0. The closer to -1.0 or 1.0, the stronger the relationship. When r is negative, that means there is a negative relationship (one variable goes up/down the other does the opposite). When r is positive, that means there is a positive relationship (one variable goes up or down so does the other). See the example below examining the correlation between texts sent per week and grades. Another way to determine the relationship and strength is to look at the graph. The closer the data points are to the line, the stronger the relationship (see Figure 2). Caution: a strong correlation does not mean that a condition caused the outcome. It only means that the two variables are related in some way.
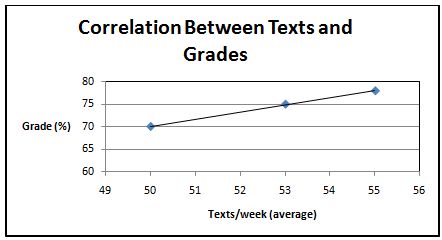
Figure 2. Graph of texts vs. grade correlation
Nonparametric Tests: (Ordinal/Nominal data)
These tests do not assume anything about the shape of the data. These tests are not as strong as the parametric ones.
Within Subject Design
- 1. Wilcoxon: This is the nonparametric version of the dependent samples t-test as it compares the difference of ranks for groups of two with only ordinal data. An example is determining participant’s ranking for visual preference between two iPad game apps.
- 2. Friedman: This is the nonparametric version of the within subjects ANOVA as it compares ranks for groups of more than two with only ordinal data. An example is determining the rank of three different websites based on user friendliness.
Between Subject Design
- 1. Chi square: Compares ranks for both two group and more than two group designs with ONLY nominal data. A. Chi square (Goodness of Fit)-Compares the proportion of the sample to an already existing value. An example would be comparing literacy rates in central Missouri against those of the entire state. B. Chi square (Test of Independence)-Compares the proportions of two variables to see if they are related or not. An example would be are there similar numbers of baseball and softball athletes enrolled in this semester’s general psychology course.
- 2. Kruskall-Wallis: This is the nonparametric version of the between subjects ANOVA as it sees if multiple samples are from the same population. An example is determining how participants rate a physician based on whether he/she used a computer, book, or no assistance in diagnosing them.
- 3. Mann-Whitney: This is the nonparametric version of the independent samples t-test as it compares ranks for groups of more than two with only ordinal data. An example would be determining if eating Snickers candy bars affects student’s grades in math courses.
- 4. Correlations: A. Spearman’s Rho: Like the Pearson correlation, this test too determines the strength of the relationship between two variables based on their ranks. An example would be to determine the relationship between physics and english course grades.
Statistical Analysis Section-Manual
Resources
The following are some additional reading resources that you may find useful:
Statistics Resources: Aron, A., Aron, E., & Coups, E. (2005). Statistics for Psychology (4th ed.). Pearson.
SPSS and Statistics Resource: Cronk, B. (2011). How to use SPSS (7th ed.). Pyrczak.